Presentation Draft
Working draft of the PowerPoint deck summarising the Chromagram project. Edit any slide below, then download the deck as PowerPoint or PDF. Your edits are saved automatically in this browser.
Preview (PowerPoint template)
Chromagram Station 60
Sound-Driven Wall Design for the New Conservatorium Parramatta Campus

- 530 individually designed panels on a 26-metre wall, across four horizontal bands
- Every panel derived directly from spectral analysis of the music: colour, shape and rhythm
Preview (PowerPoint template)
The Four Compositions
Each band is driven by one commissioned work


Preview (PowerPoint template)
The Design Pipeline
From audio file to physical panel
each wall band is assigned one composition
each timeline divided into cues anchoring panel groups
Pitch, Rhythm, Intensity, Density at each cue
12 bins routed to 7 panel types
all 530 panels composited at true scale for fabrication
OUTPUT — THE FINAL CHROMAGRAM (ALL FOUR BANDS)


Preview (PowerPoint template)
The Four Analysis Systems
Each extracts a different acoustic dimension
Pitch
Constant-Q decomposition onto the 12 chromatic pitch classes

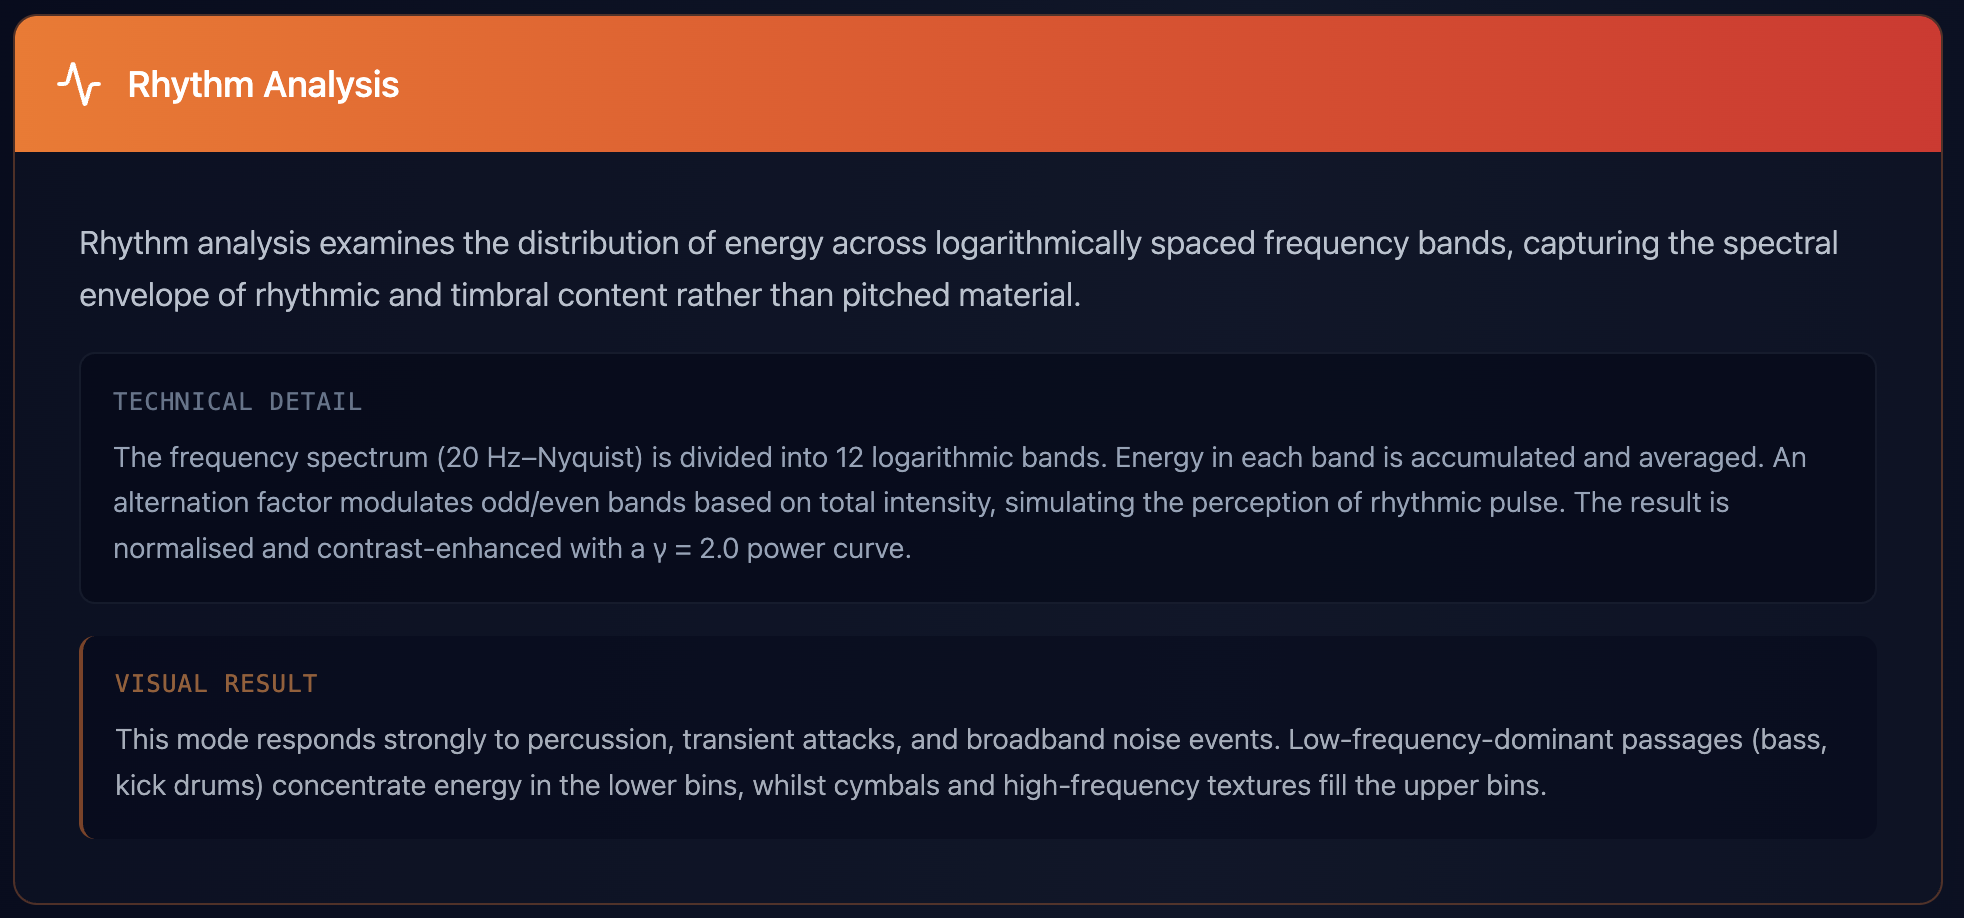
Rhythm
spectral energy across 12 logarithmic frequency bands

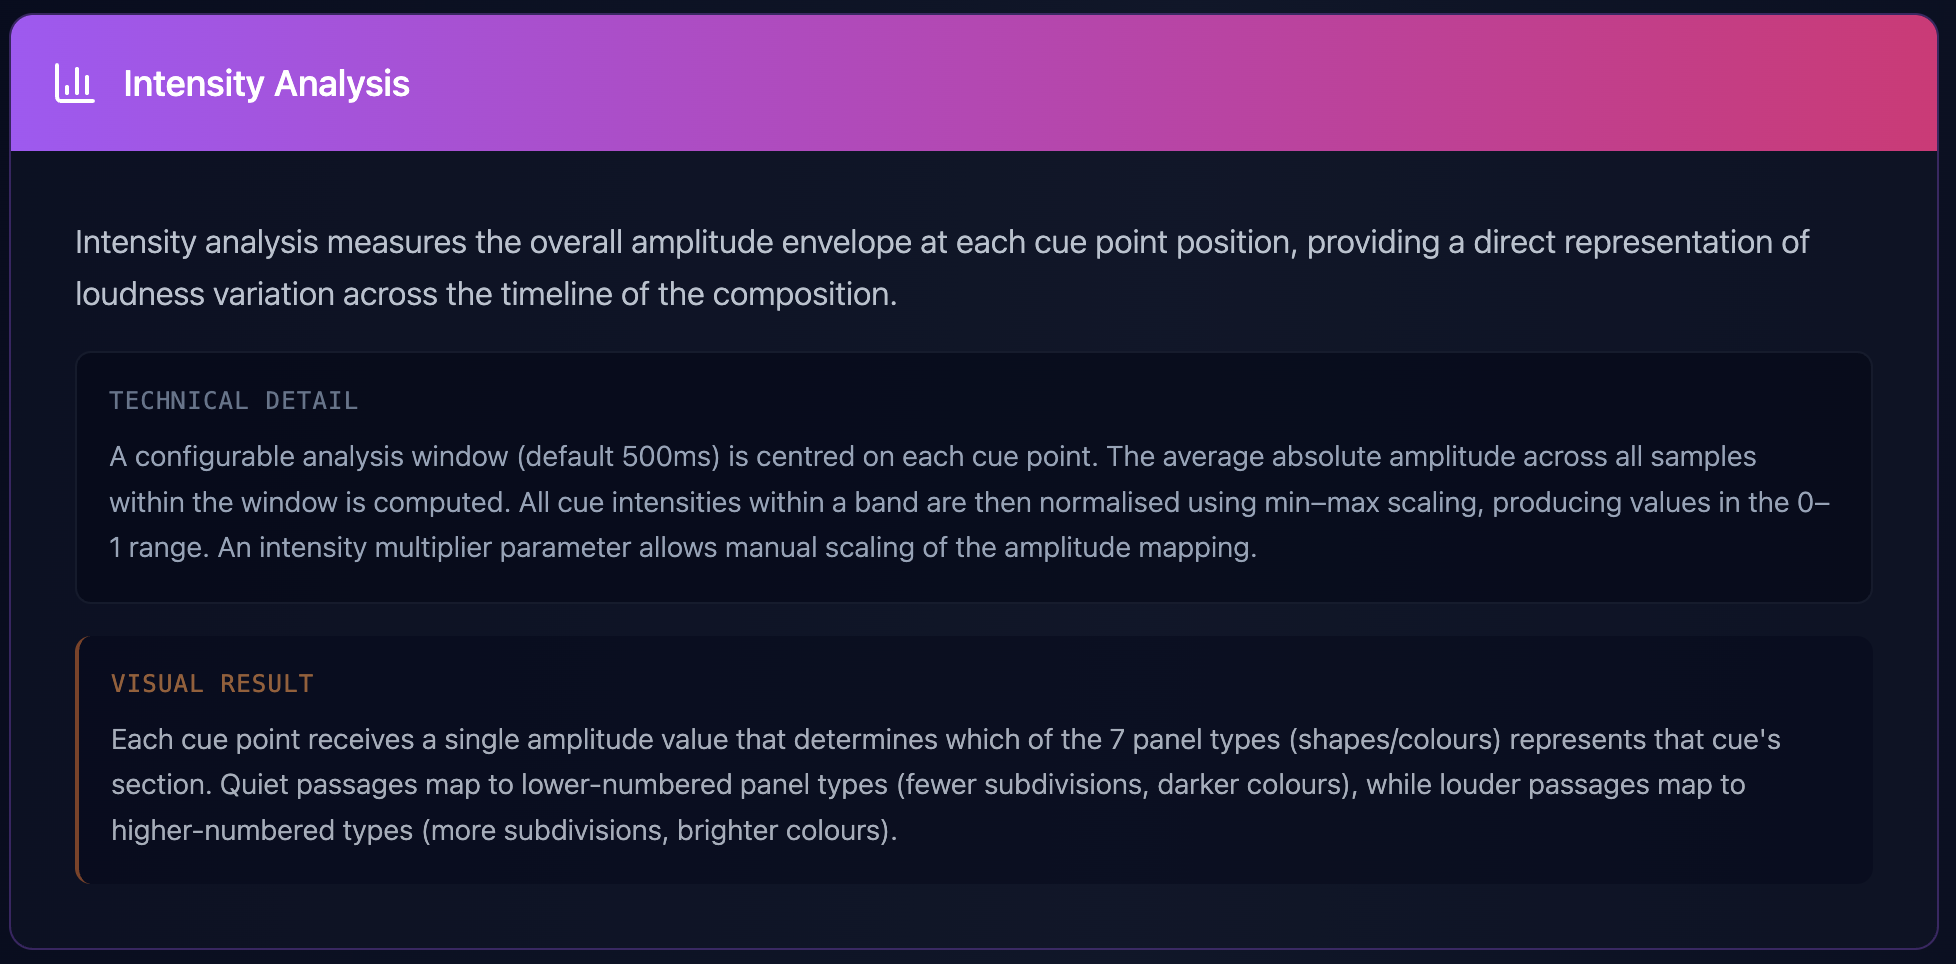
Intensity
normalised amplitude envelope per cue point

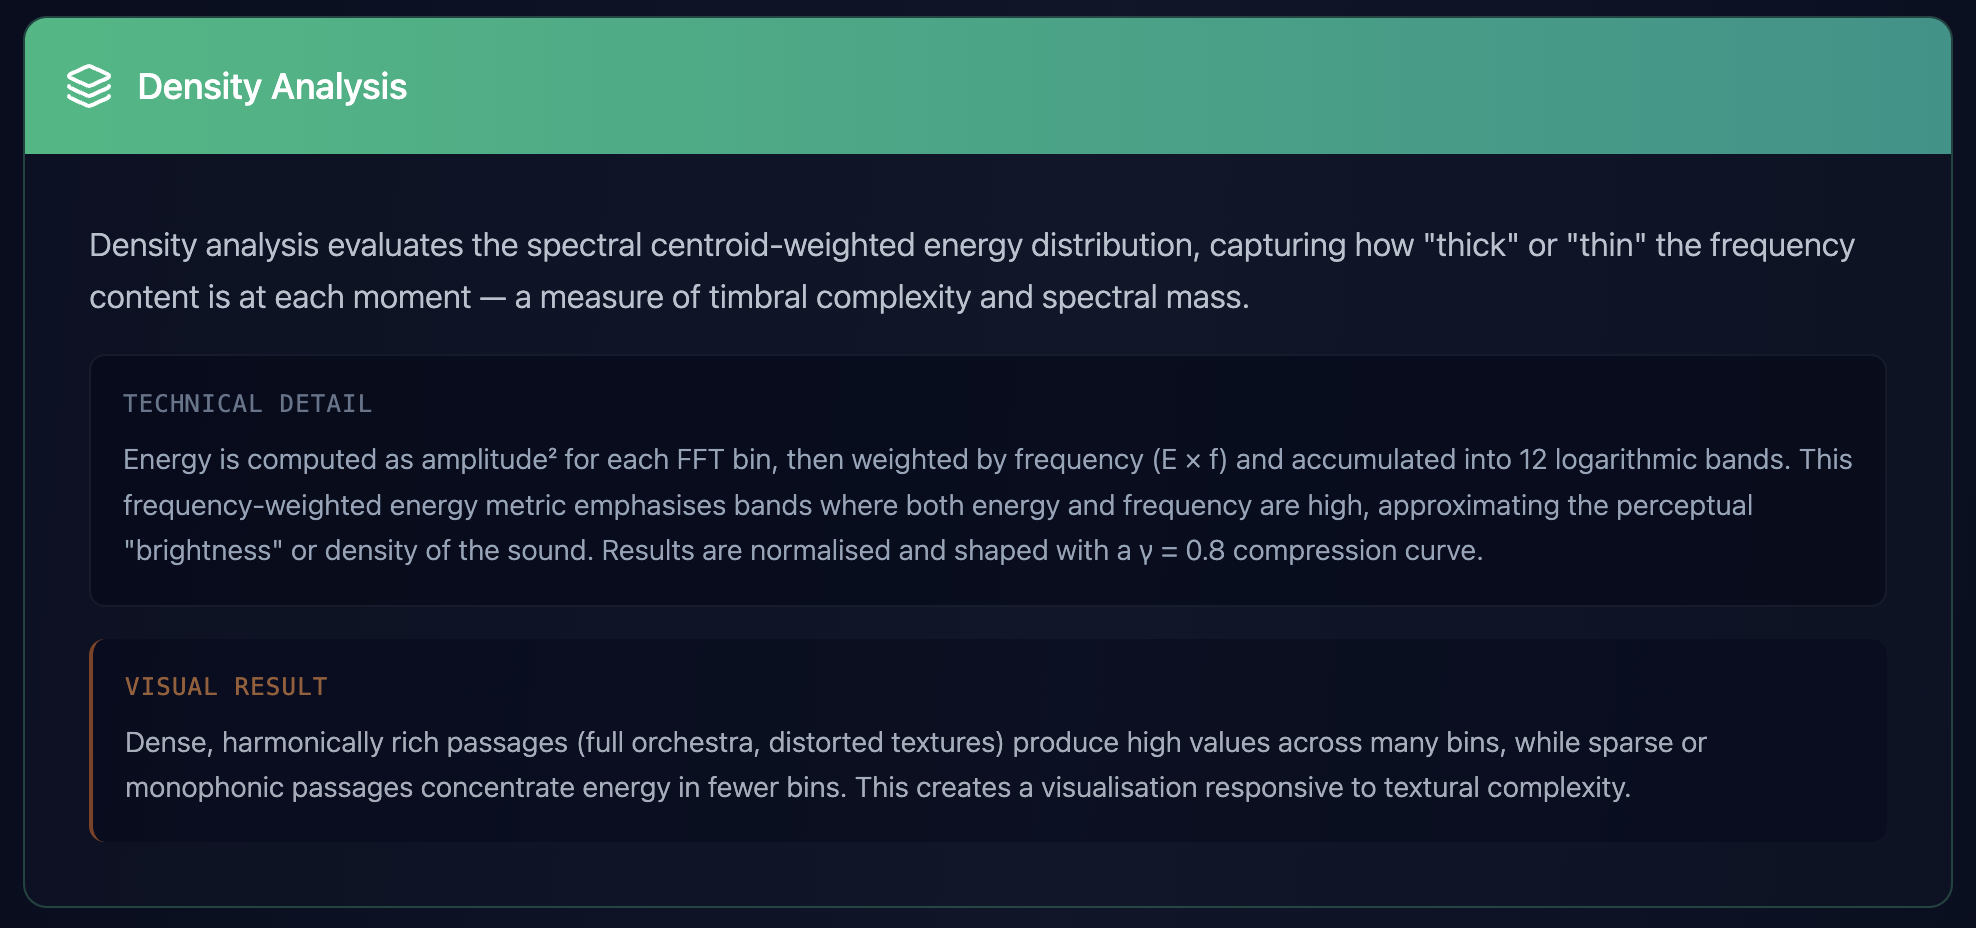
Density
frequency-weighted spectral mass: textural complexity

All four systems output the same 12-bin array, so any mode drives any band
Preview (PowerPoint template)
Panel Types, Colour & Fabrication
Turning data into a buildable wall

Type 1
Curved Arch

Type 2
Stepped

Type 3
3 Semi-Circles

Type 4
2 Semi-Circles

Type 5
Sawtooth

Type 6
3 Semi (high)

Type 7
Sawtooth (max)
LAVA COLOUR SCHEMA — QUIET TO MAXIMUM ENERGY

- 7 panel types: 1-3 internal divisions, each a distinct shape and colour
- Lava colour schema: deep reds (quiet) to bright corals (maximum energy)
- Patch-cord mapping routes chromagram bins to panel types, per band
- Exports: JSON shape sequences + fabrication-ready PDF with legend
- Output: a data-driven blueprint for all 530 panels
Preview (PowerPoint template)
The Wall in Numbers
The installation at a glance
530
individually designed acoustic panels
26 m
the length of the feature wall
4
horizontal bands, one per composition
7
distinct panel types, each with its own colour
12
analysis bins driving every panel decision
Preview (PowerPoint template)
Interactive Pattern Recognition
Playing the wall: from scan to sound
- A camera above the wall scans the physical chromagram bands
- Each band is fingerprinted from its colour sequence of panel shapes
- The fingerprint is matched against the four registered compositions
- On a match, the corresponding composition plays automatically
- Visitors explore the installation simply by pointing at the wall
Preview (PowerPoint template)
The Auditorium Experience
What visitors see and hear
- Immersive ultrawide, radial and aboriginal visual modes
- Live spectral analysis drives the visuals in real time
- Drag-to-scrub playback lets visitors explore the timeline
- Recording tools capture performance clips with audio
- Designed for projection and large-format display
Preview (PowerPoint template)
Data & Fabrication Output
Everything the wall needs to be built
- JSON shape sequences for every panel, keyed by band and cue
- Fabrication-ready PDF with panel legend and colour mapping
- Digital presentations summarising the design for stakeholders
- Audio analysis archives for future recomposition
- A complete digital twin of the physical wall
Preview (PowerPoint template)
The Facade Section
Elevation: four bands at true scale
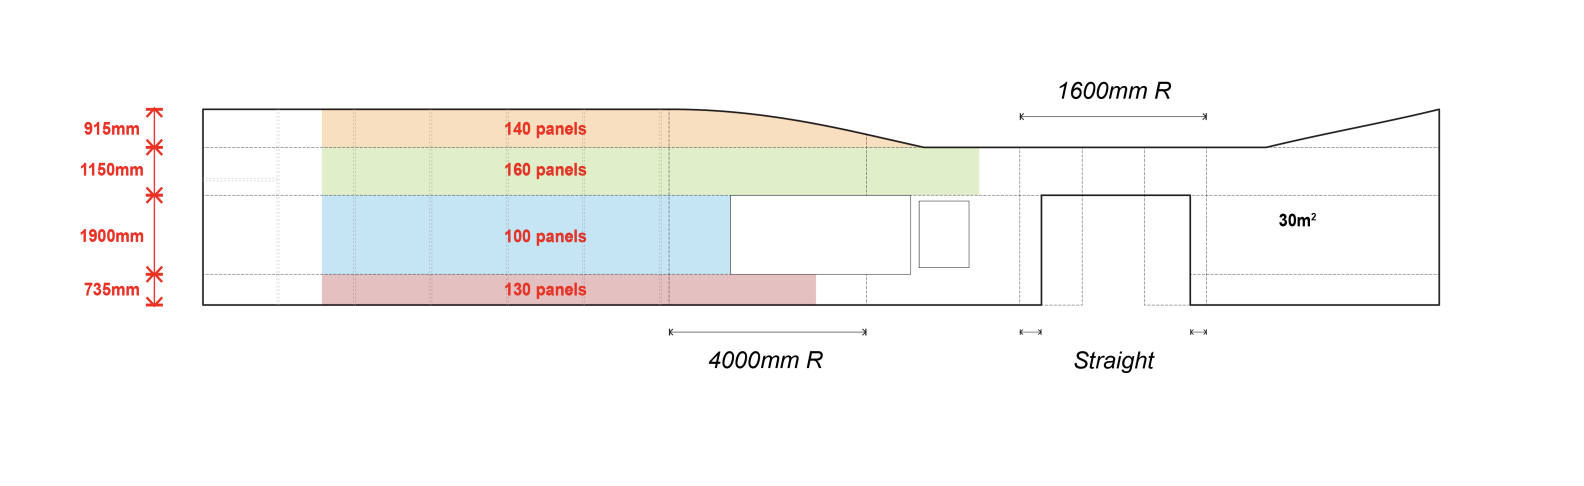
- Wall elevation: 530 panels across four horizontal bands
- 140, 160, 100 and 130 panels per band, top to bottom
- The wall sweeps on 4000 mm and 1600 mm radii before a straight end
- Band heights range from 735 mm to 1900 mm across the 30 m² wall
Preview (PowerPoint template)
The Updated Facade
The built wall: colour and rhythm in place
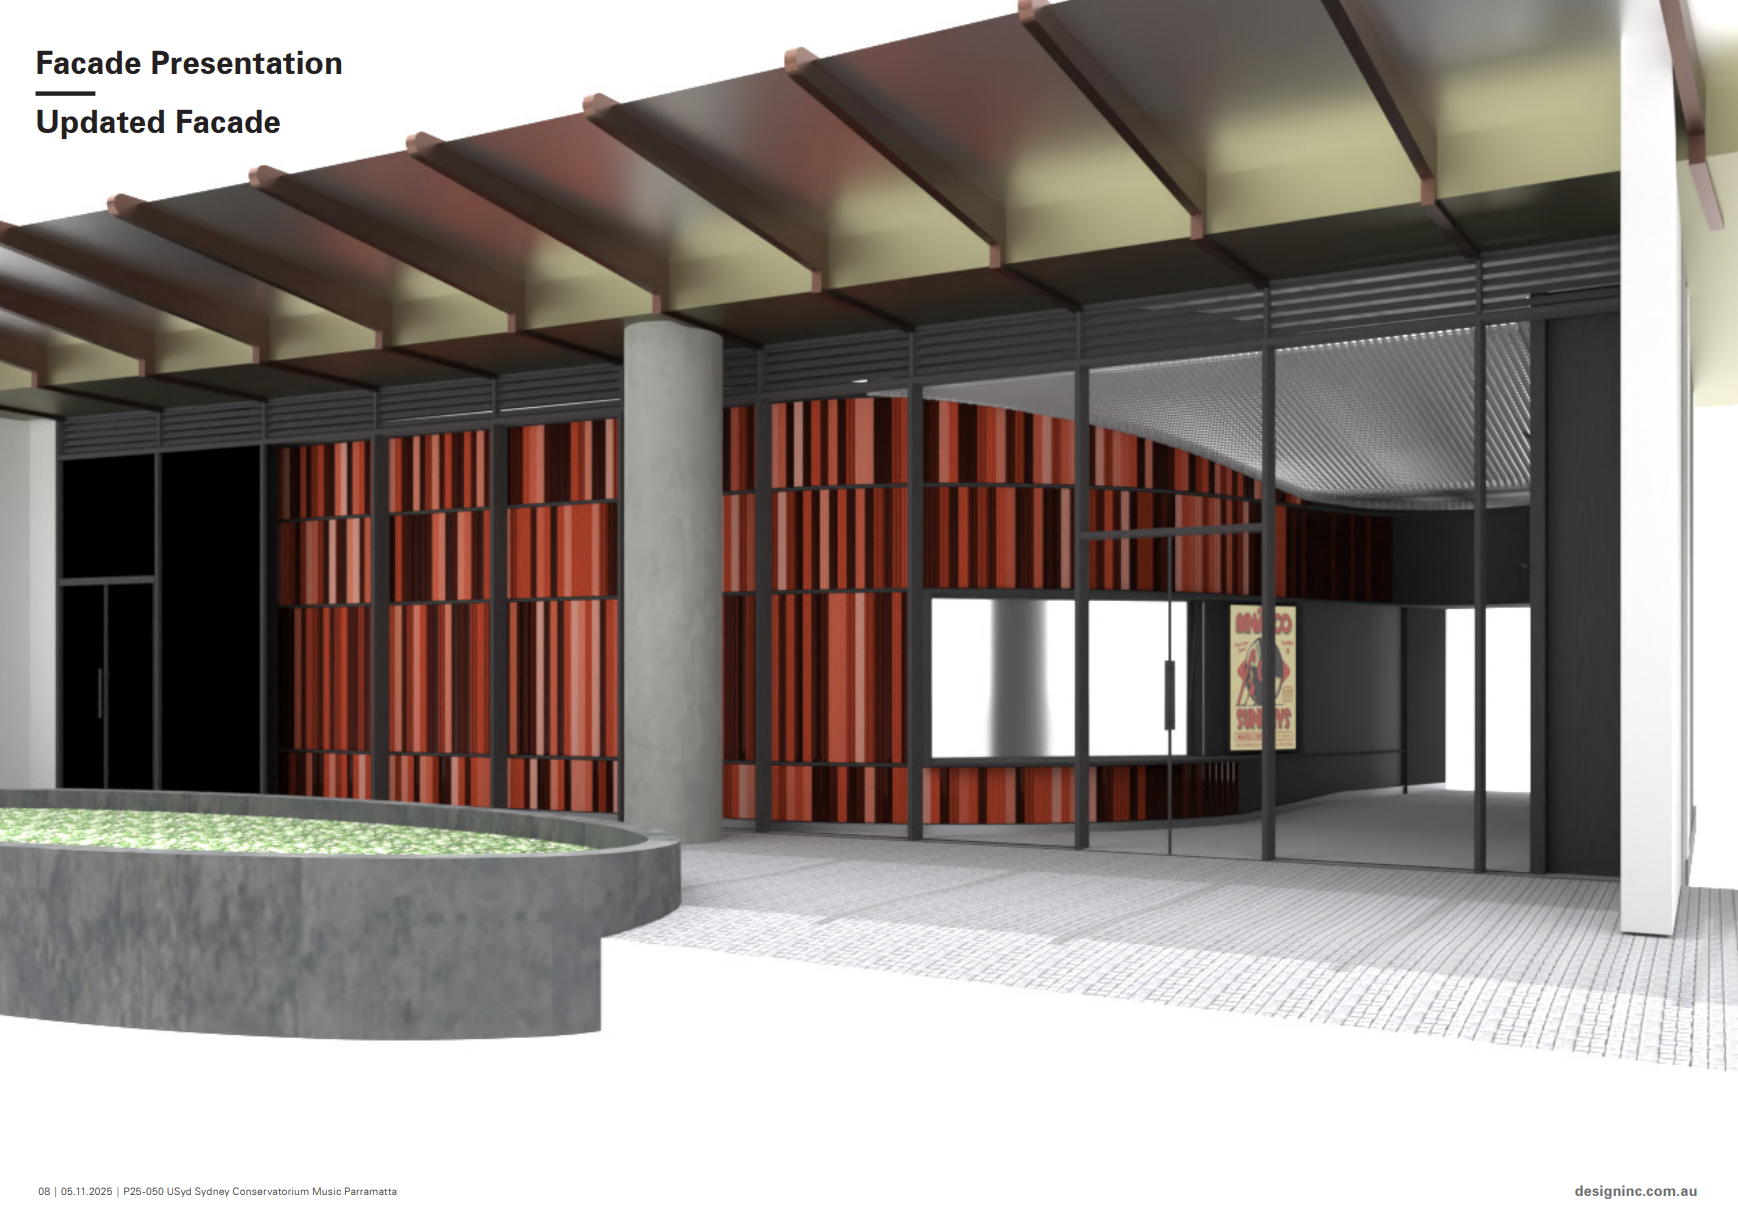
- The rendered facade: each band shows its composition’s chromagram
- Panel colours and divisions carry the music’s pitch, intensity and rhythm
- Deep reds hold the quiet passages; bright corals mark the loudest
- The curved wall wraps the conservatorium entry in flowing panels
Preview (PowerPoint template)
The Four Analysis Views
Screenshots of each analysis system in action
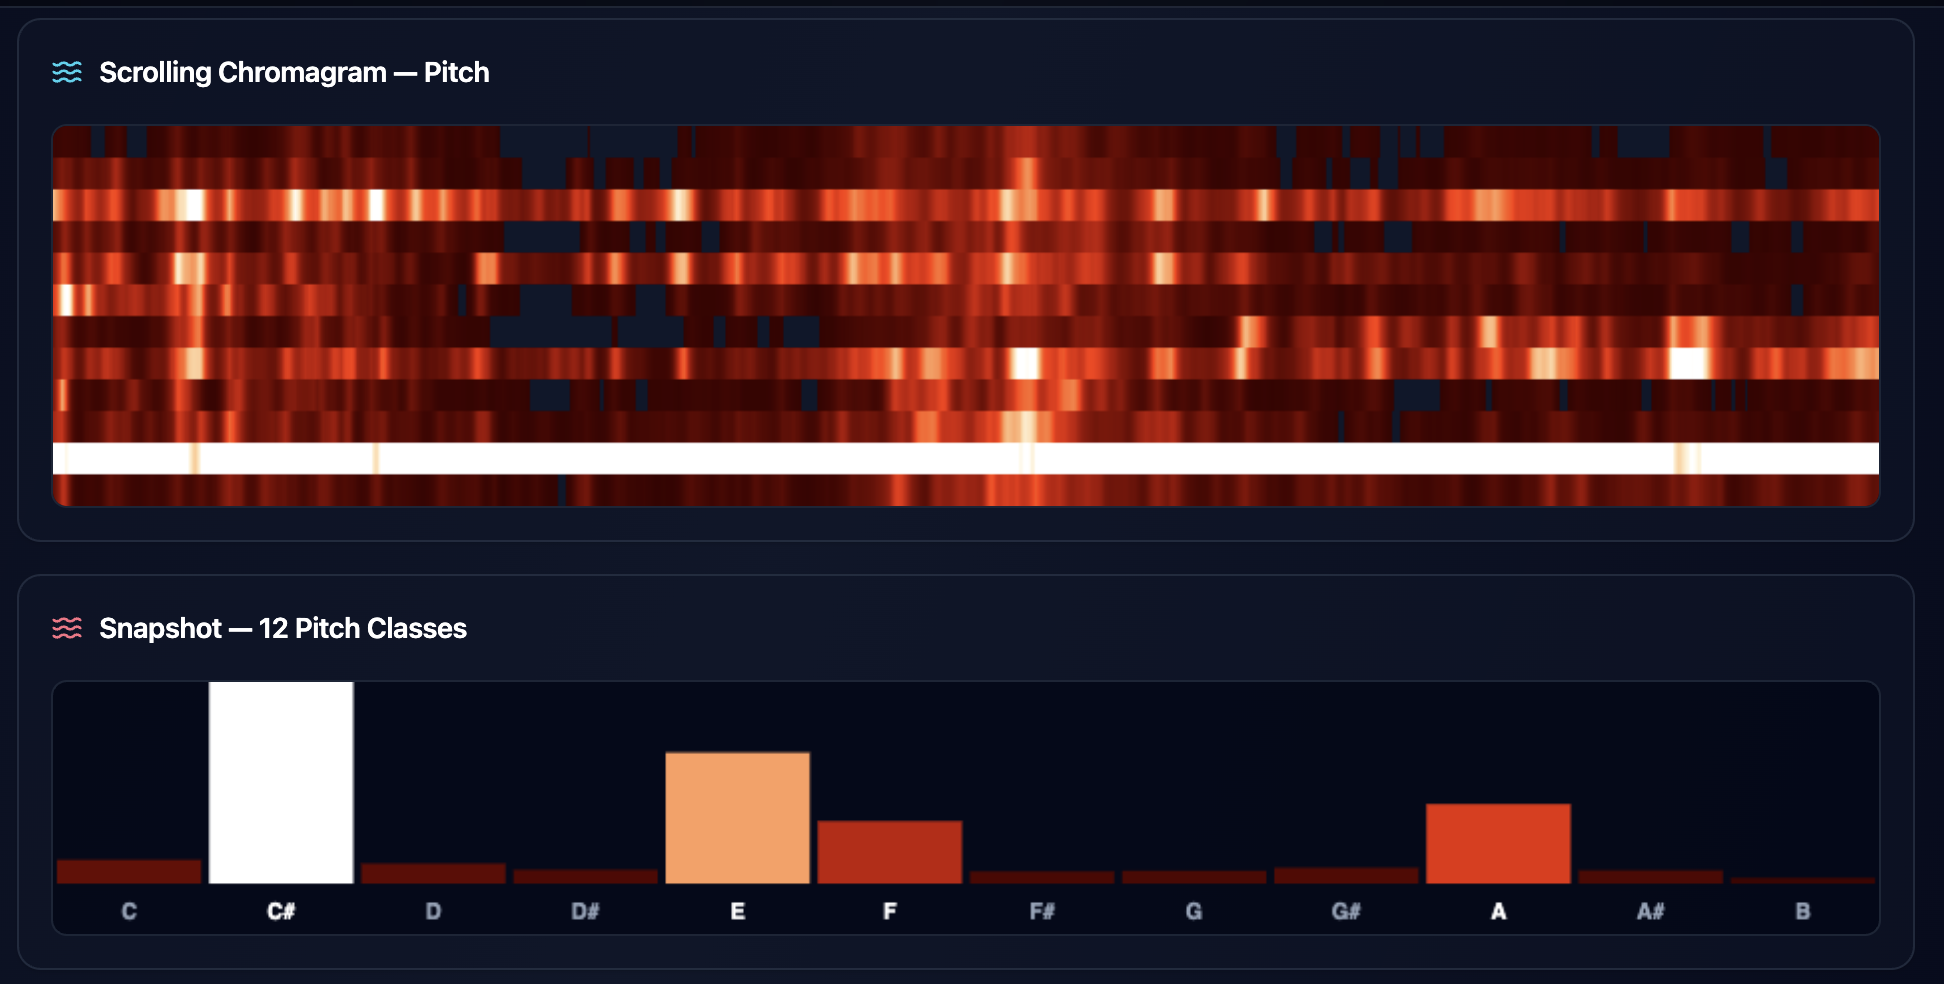
Pitch — chromatic heatmap across the 12 pitch classes

Rhythm — spectral pulse across the frequency bands

Intensity — the amplitude envelope over time

Density — textural complexity across the timeline

Preview (PowerPoint template)
Analysis as One System
All four readings combined on one shared timeline
- Every system reads the same audio frame at each cue point
- All four output the identical 12-bin array — one shared language
- Combined they route pitch, rhythm, loudness and texture into the wall
- Any visualisation mode or band can be driven by any system or all four

The four analysis systems on one shared timeline
Preview (PowerPoint template)
The Analysis Systems in Detail
Detail cards from the original design tool
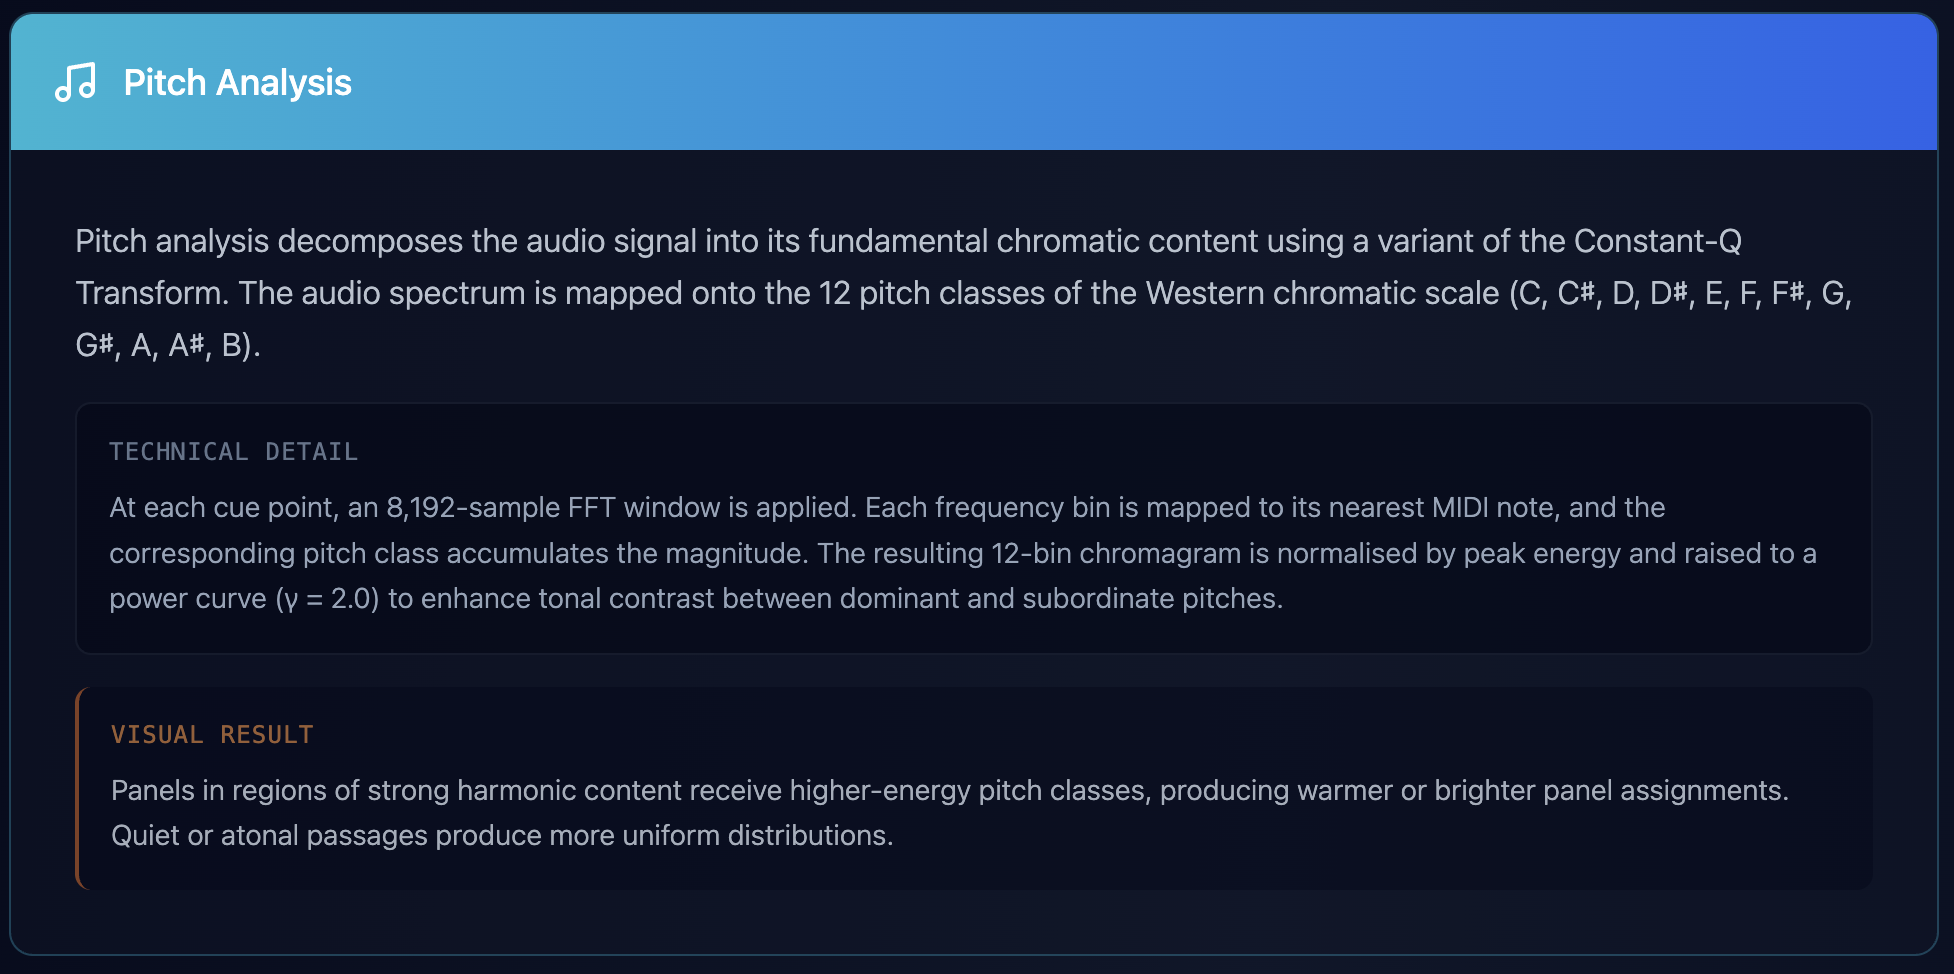
Pitch — Constant-Q transform, 12 chromatic pitch classes
Rhythm — 12 logarithmic frequency bands, spectral pulse
Intensity — amplitude envelope at each cue point
Density — spectral centroid-weighted energy distribution
Preview (PowerPoint template)
Colour Mapping
From panel types to colour
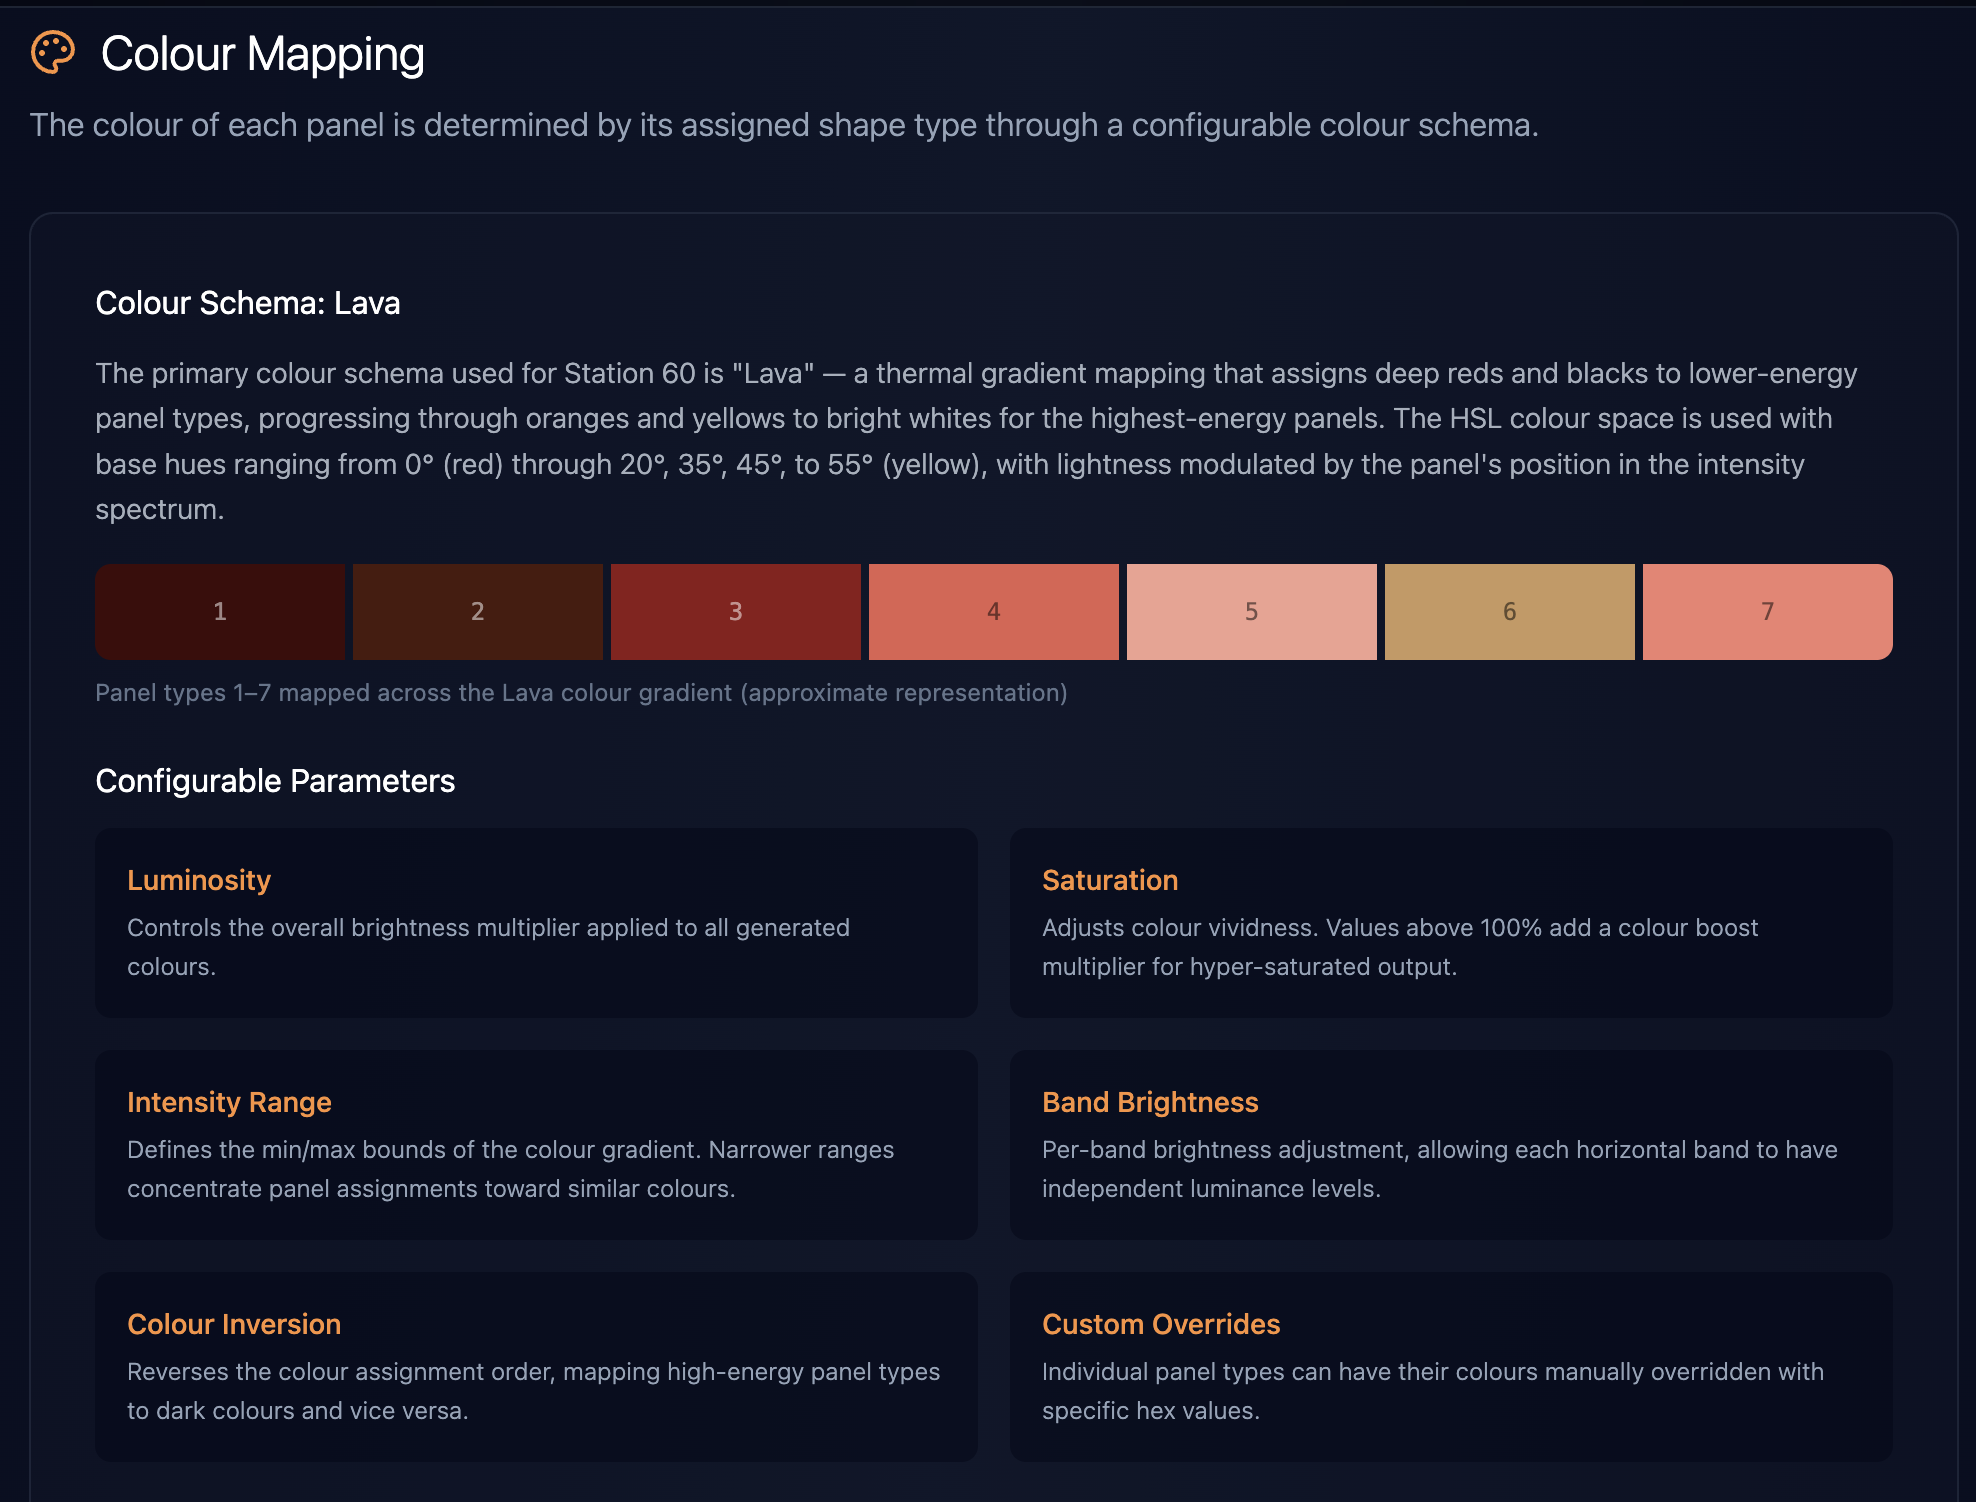
- The "Lava" schema: deep reds and blacks through oranges and yellows to bright whites
- HSL colour space: hues 0° (red) to 55° (yellow), lightness follows the intensity spectrum
- Luminosity and saturation control overall brightness and colour vividness
- Intensity range narrows or widens the gradient; band brightness tunes each band
- Colour inversion reverses the order; custom overrides re-map individual panel types
Preview (PowerPoint template)
Shapes Mapping
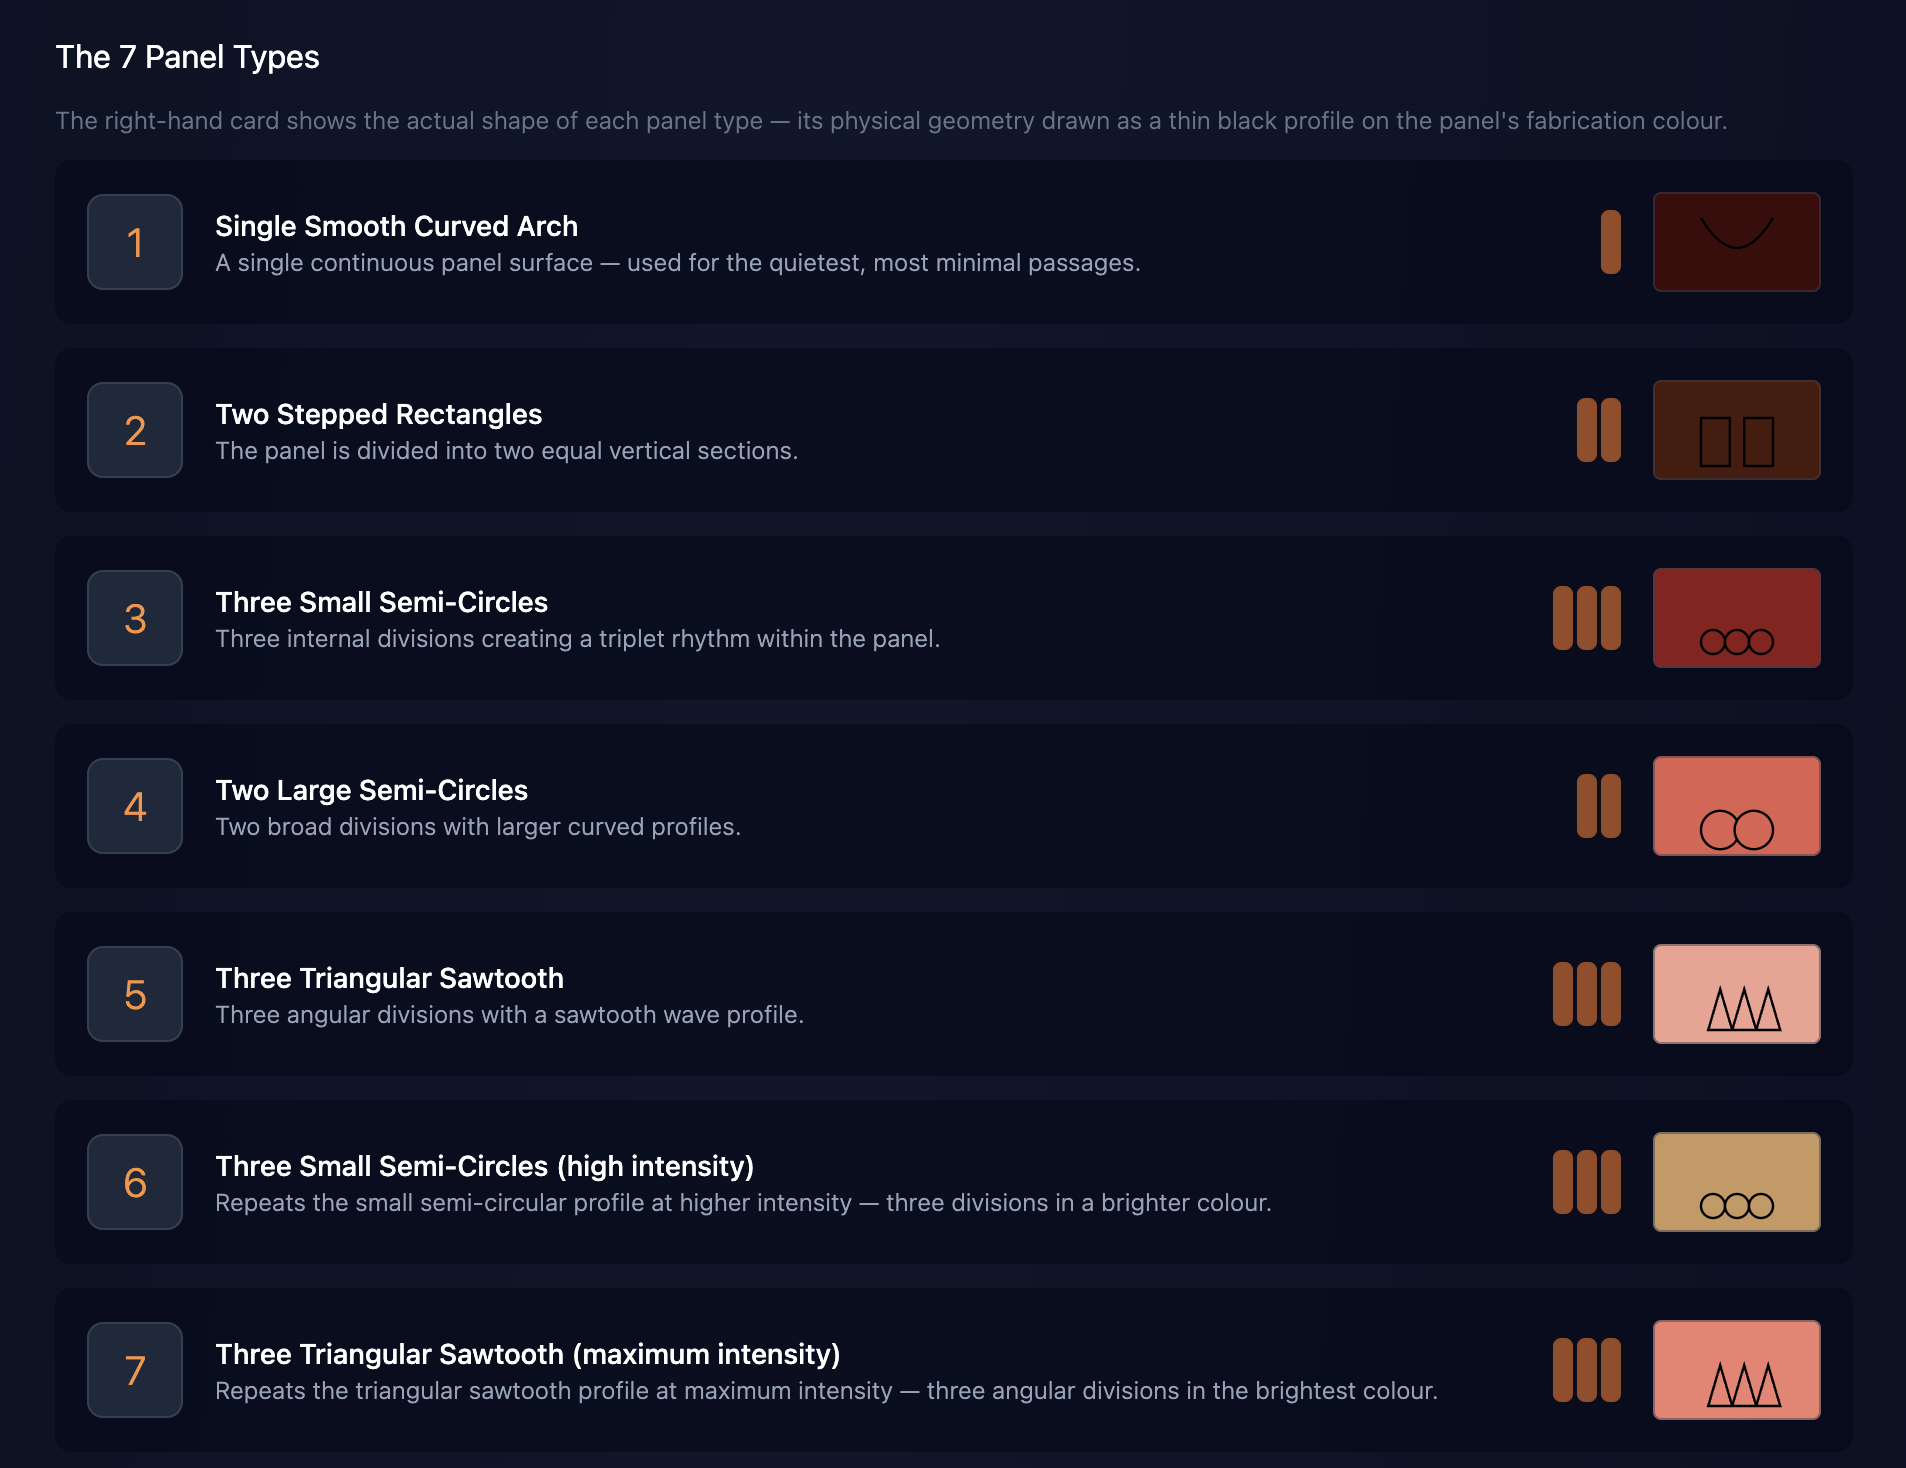
The 7 panel types of Station 60
- Type 1 — Single smooth curved arch: the quietest, most minimal passages
- Type 2 — Two stepped rectangles: two equal vertical sections
- Type 3 — Three small semi-circles: a triplet rhythm within the panel
- Type 4 — Two large semi-circles: two broad divisions with larger curves
- Type 5 — Three triangular sawtooth: three angular sawtooth divisions
- Types 6 & 7 — repeat semi-circles and sawtooth at high / maximum intensity
Preview (PowerPoint template)
Colour Mapping Exploration
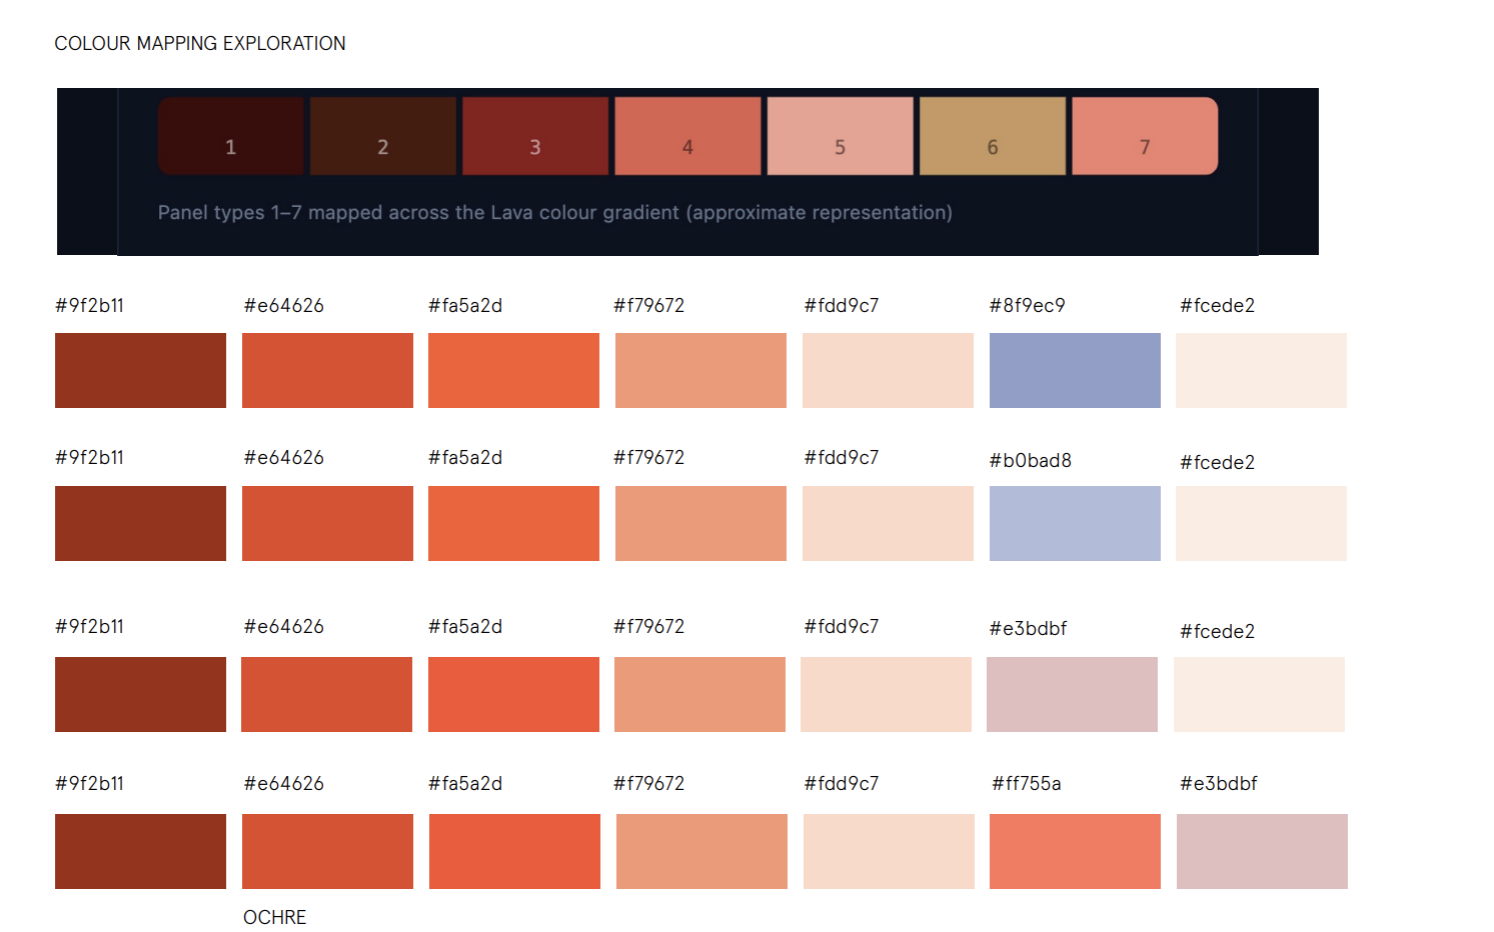
Panel types 1-7 across the palette schemes
- Panel types 1-7 mapped across the Lava colour gradient, per band
- Hex swatches show the exact fabrication colours for each panel type
- Alternate rows explore warm, muted and brighter variants
- Colours stay warm-neutral so the wall reads as one family of reds
Preview (PowerPoint template)
Pitch Clustering & Sampling
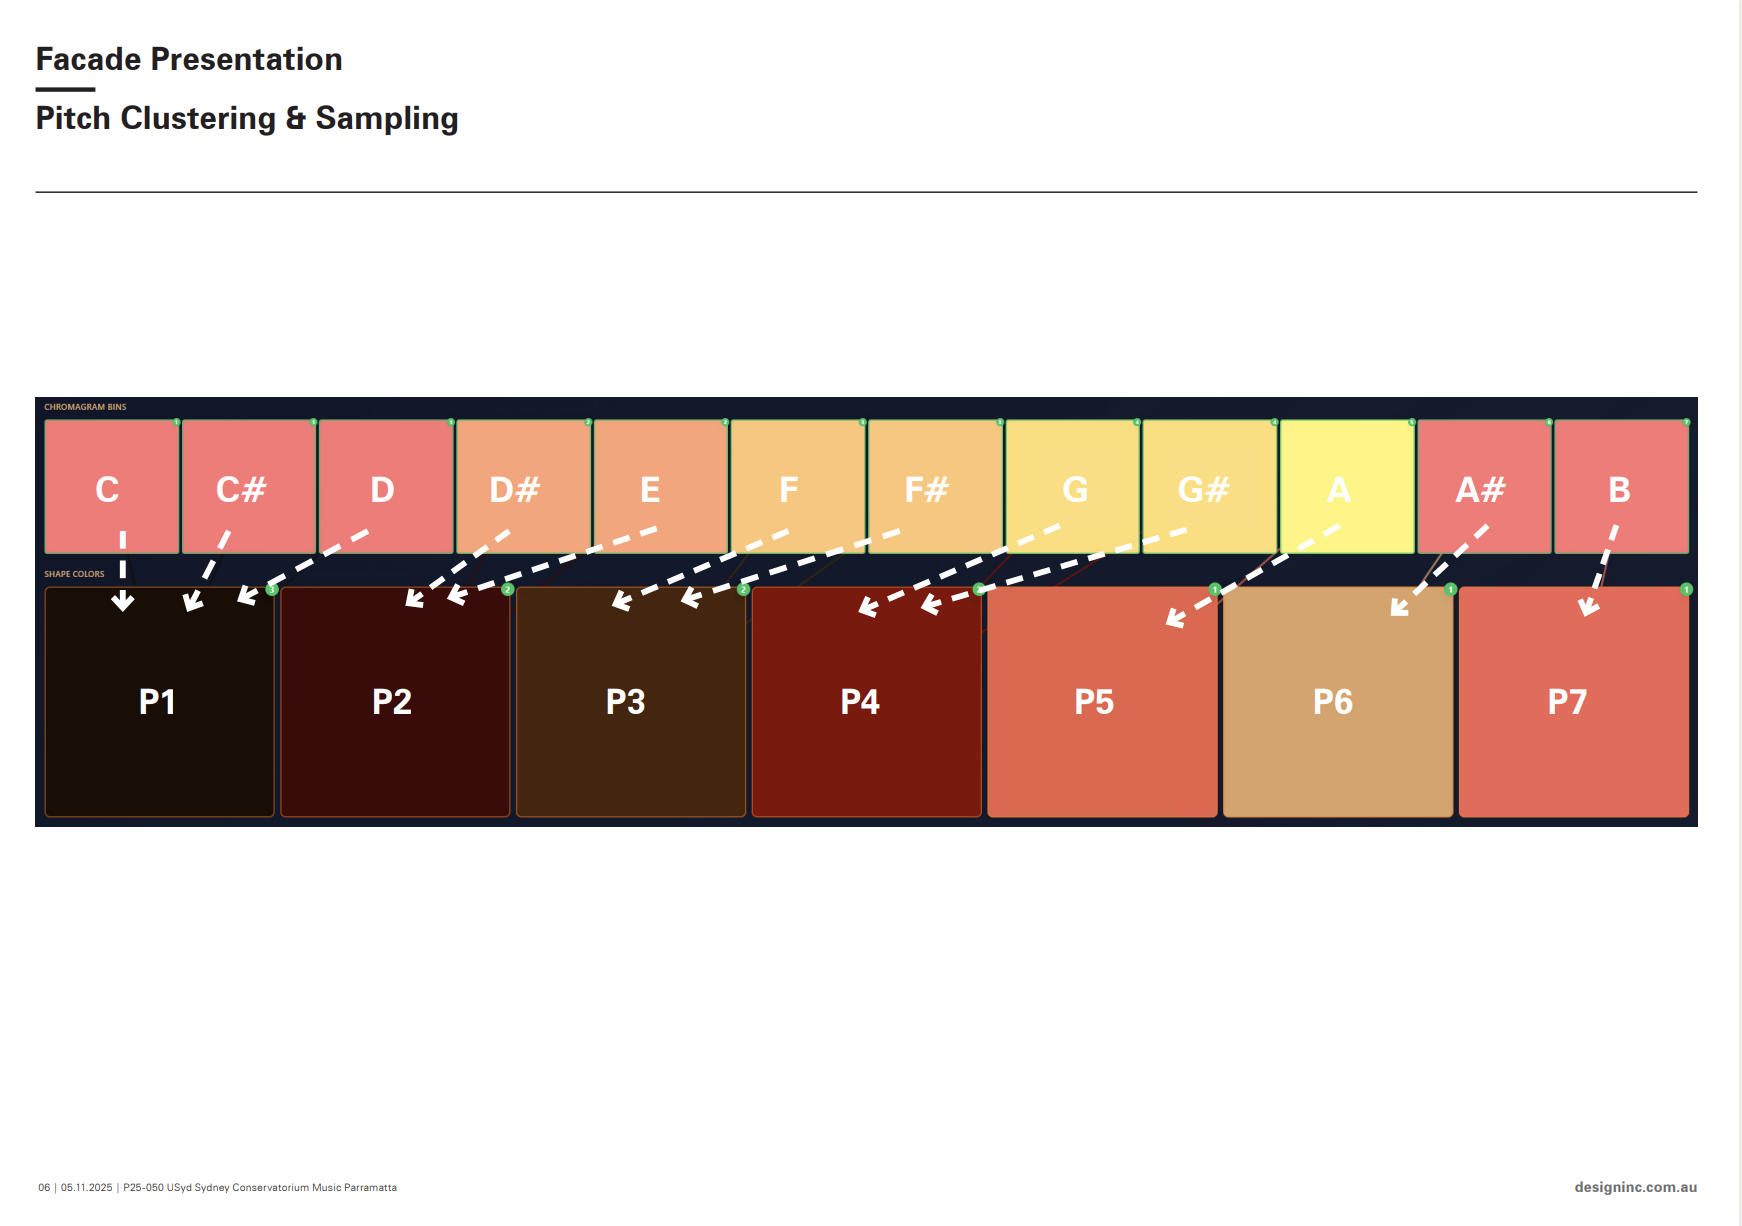
Chromagram bins routed to shape colours
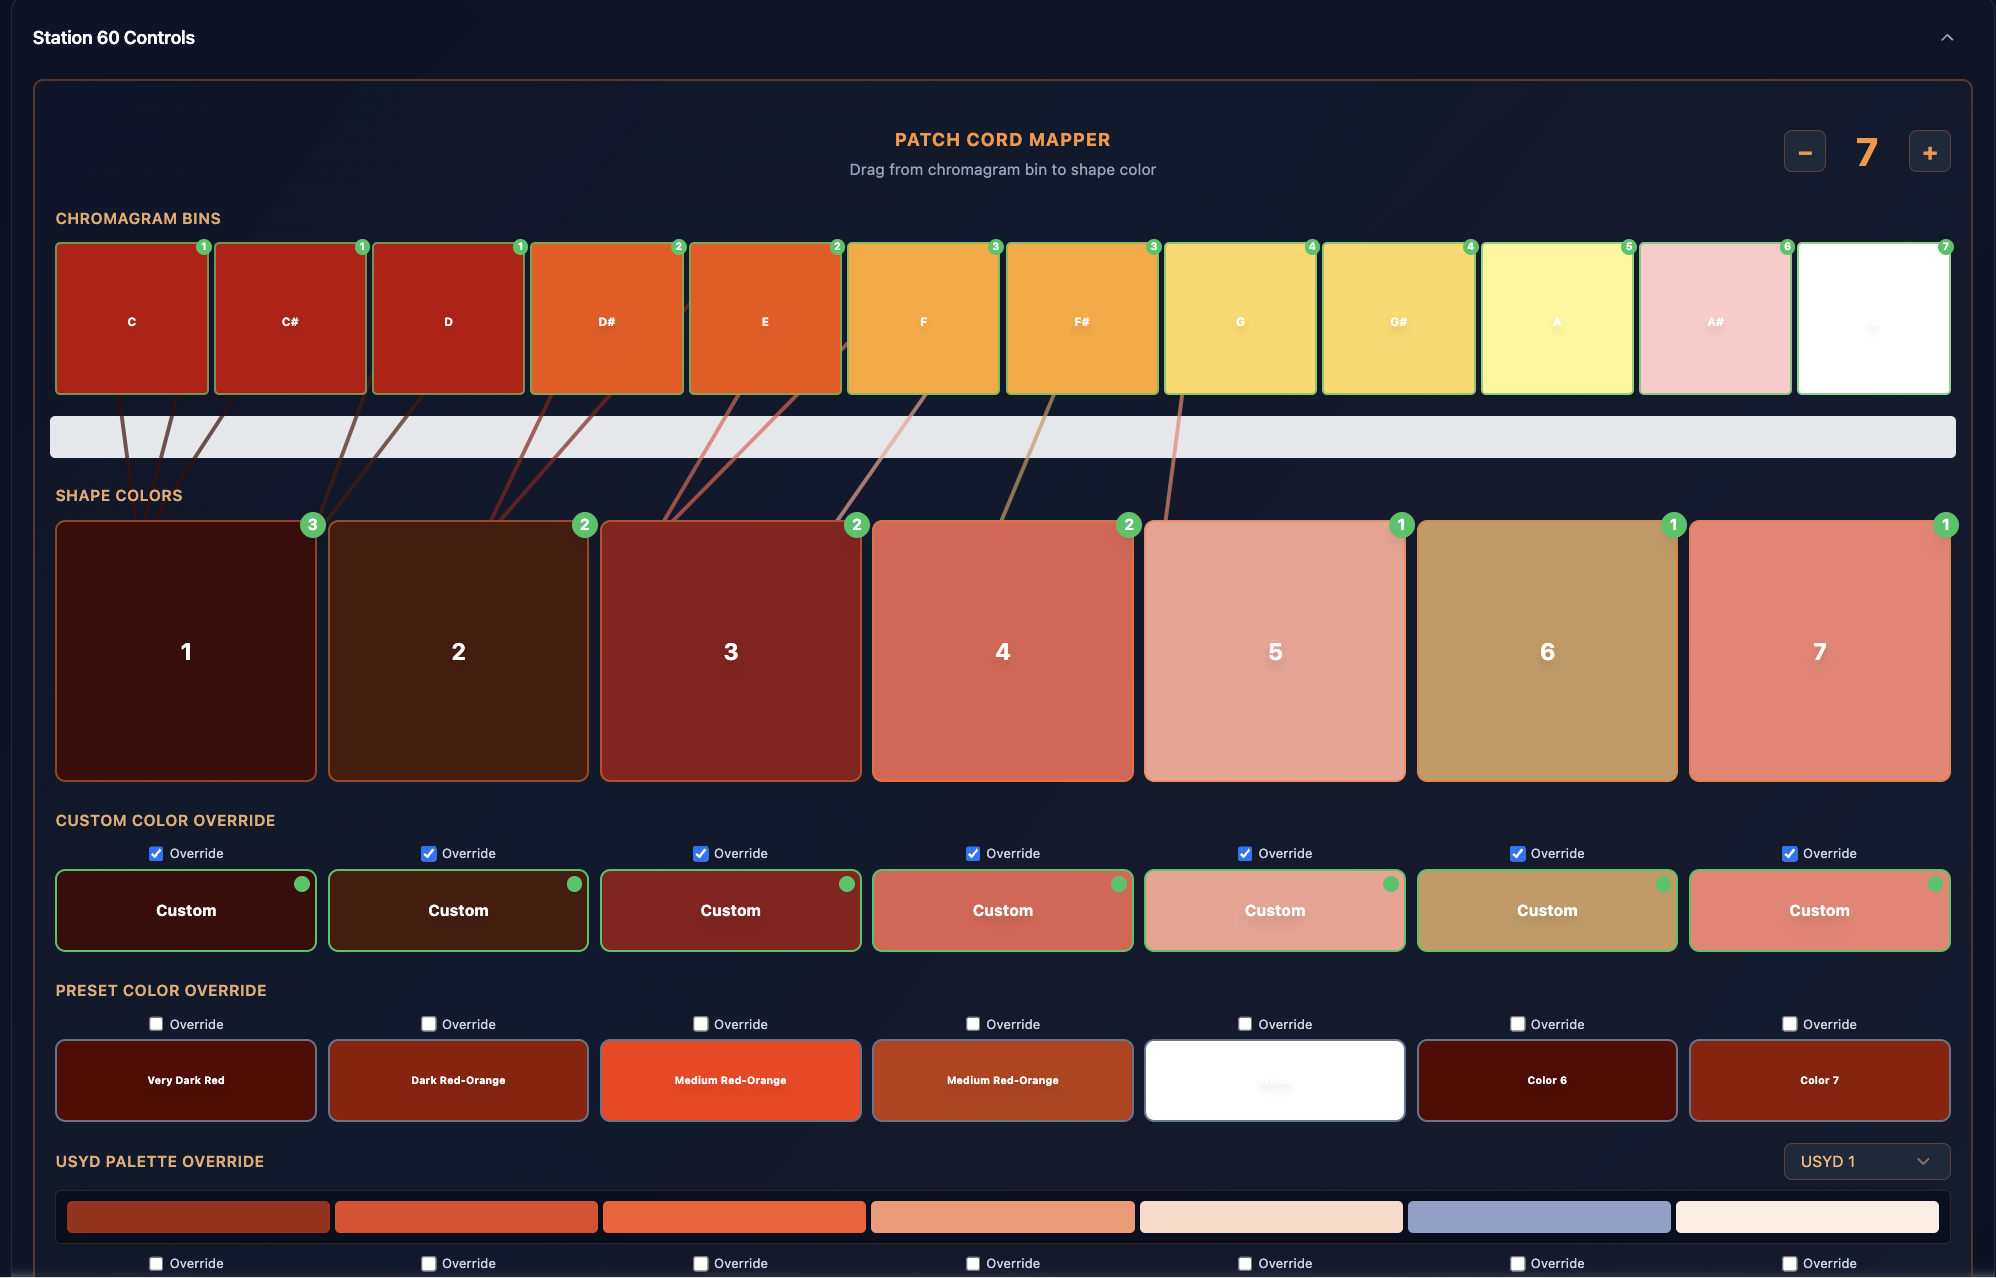
- The 12 chromagram bins (C to B) cluster onto the 7 shape colours
- Dashed arrows show the routing from pitch classes to panels P1-P7
- Bin ordering follows the chromatic scale: C, C#, D ... A#, B
- Each panel type receives the combined energy of its assigned bins
Preview (PowerPoint template)
Visualisation Modes
How the live analysis is displayed
Scrolling chromagram — pitch classes over time
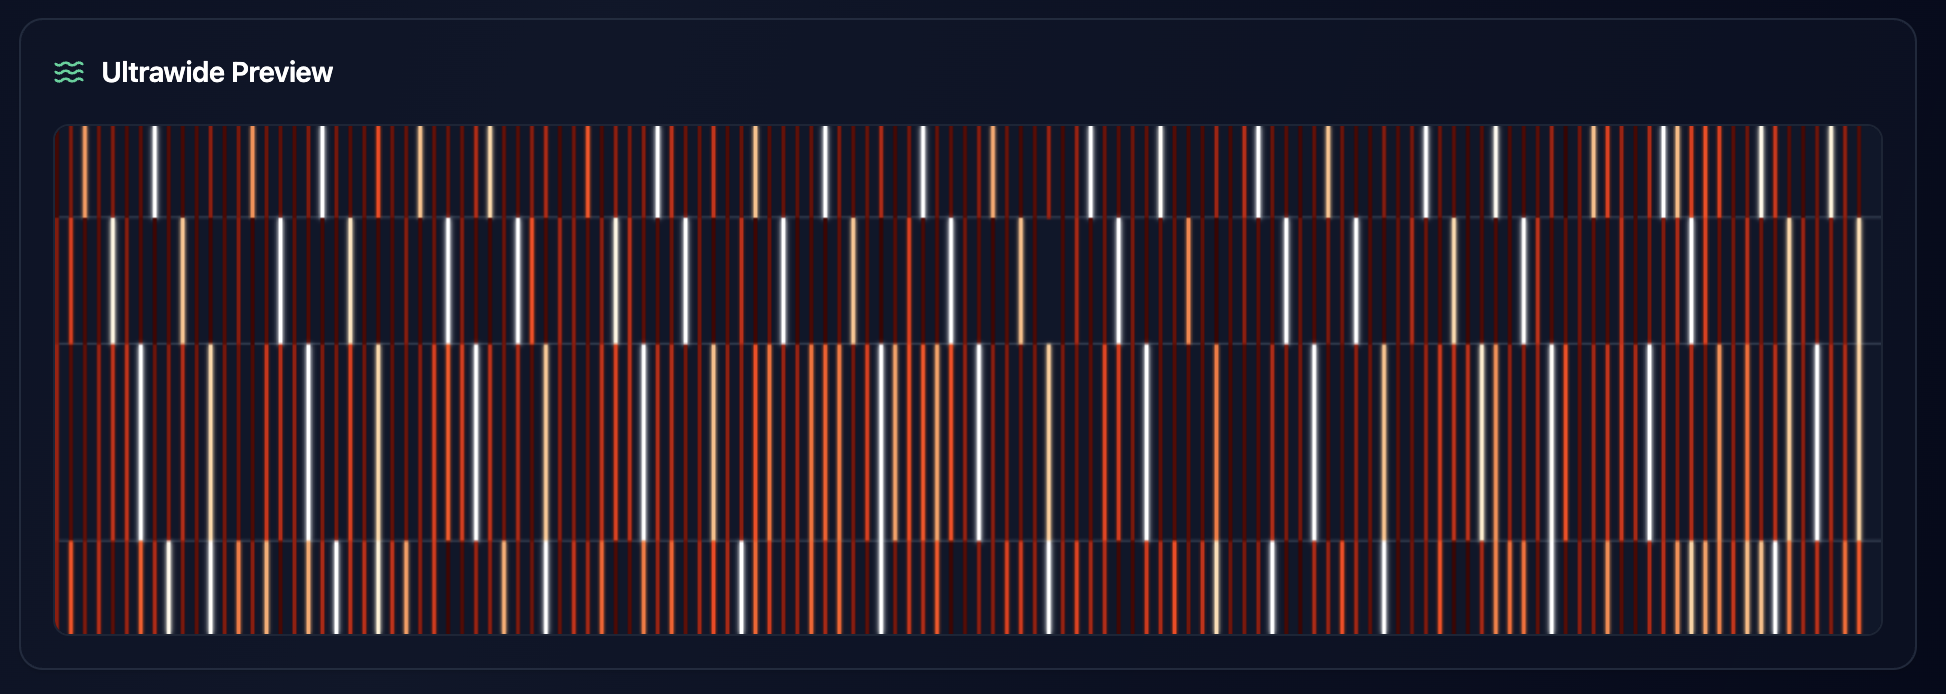
Ultrawide preview — the wall as one continuous strip
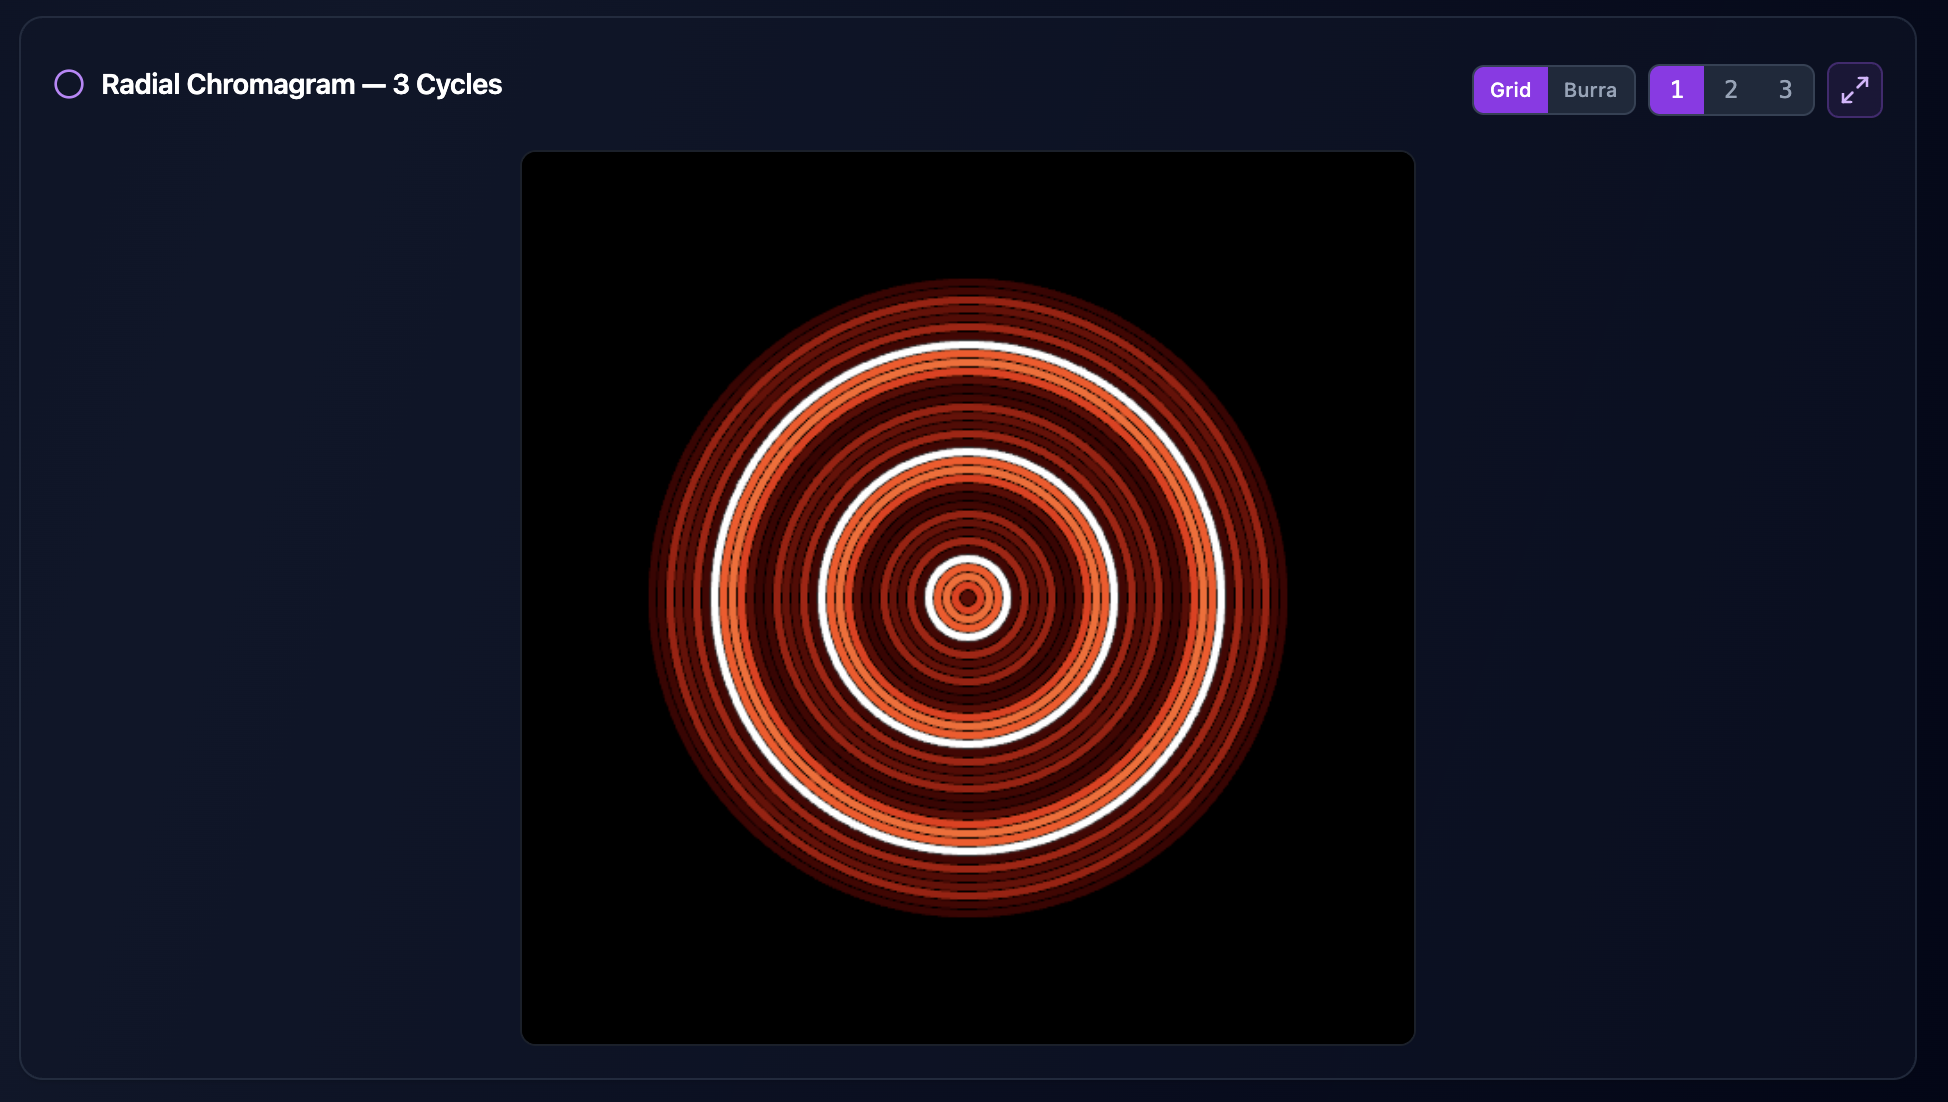
Radial chromagram — 3 cycles, grid mode
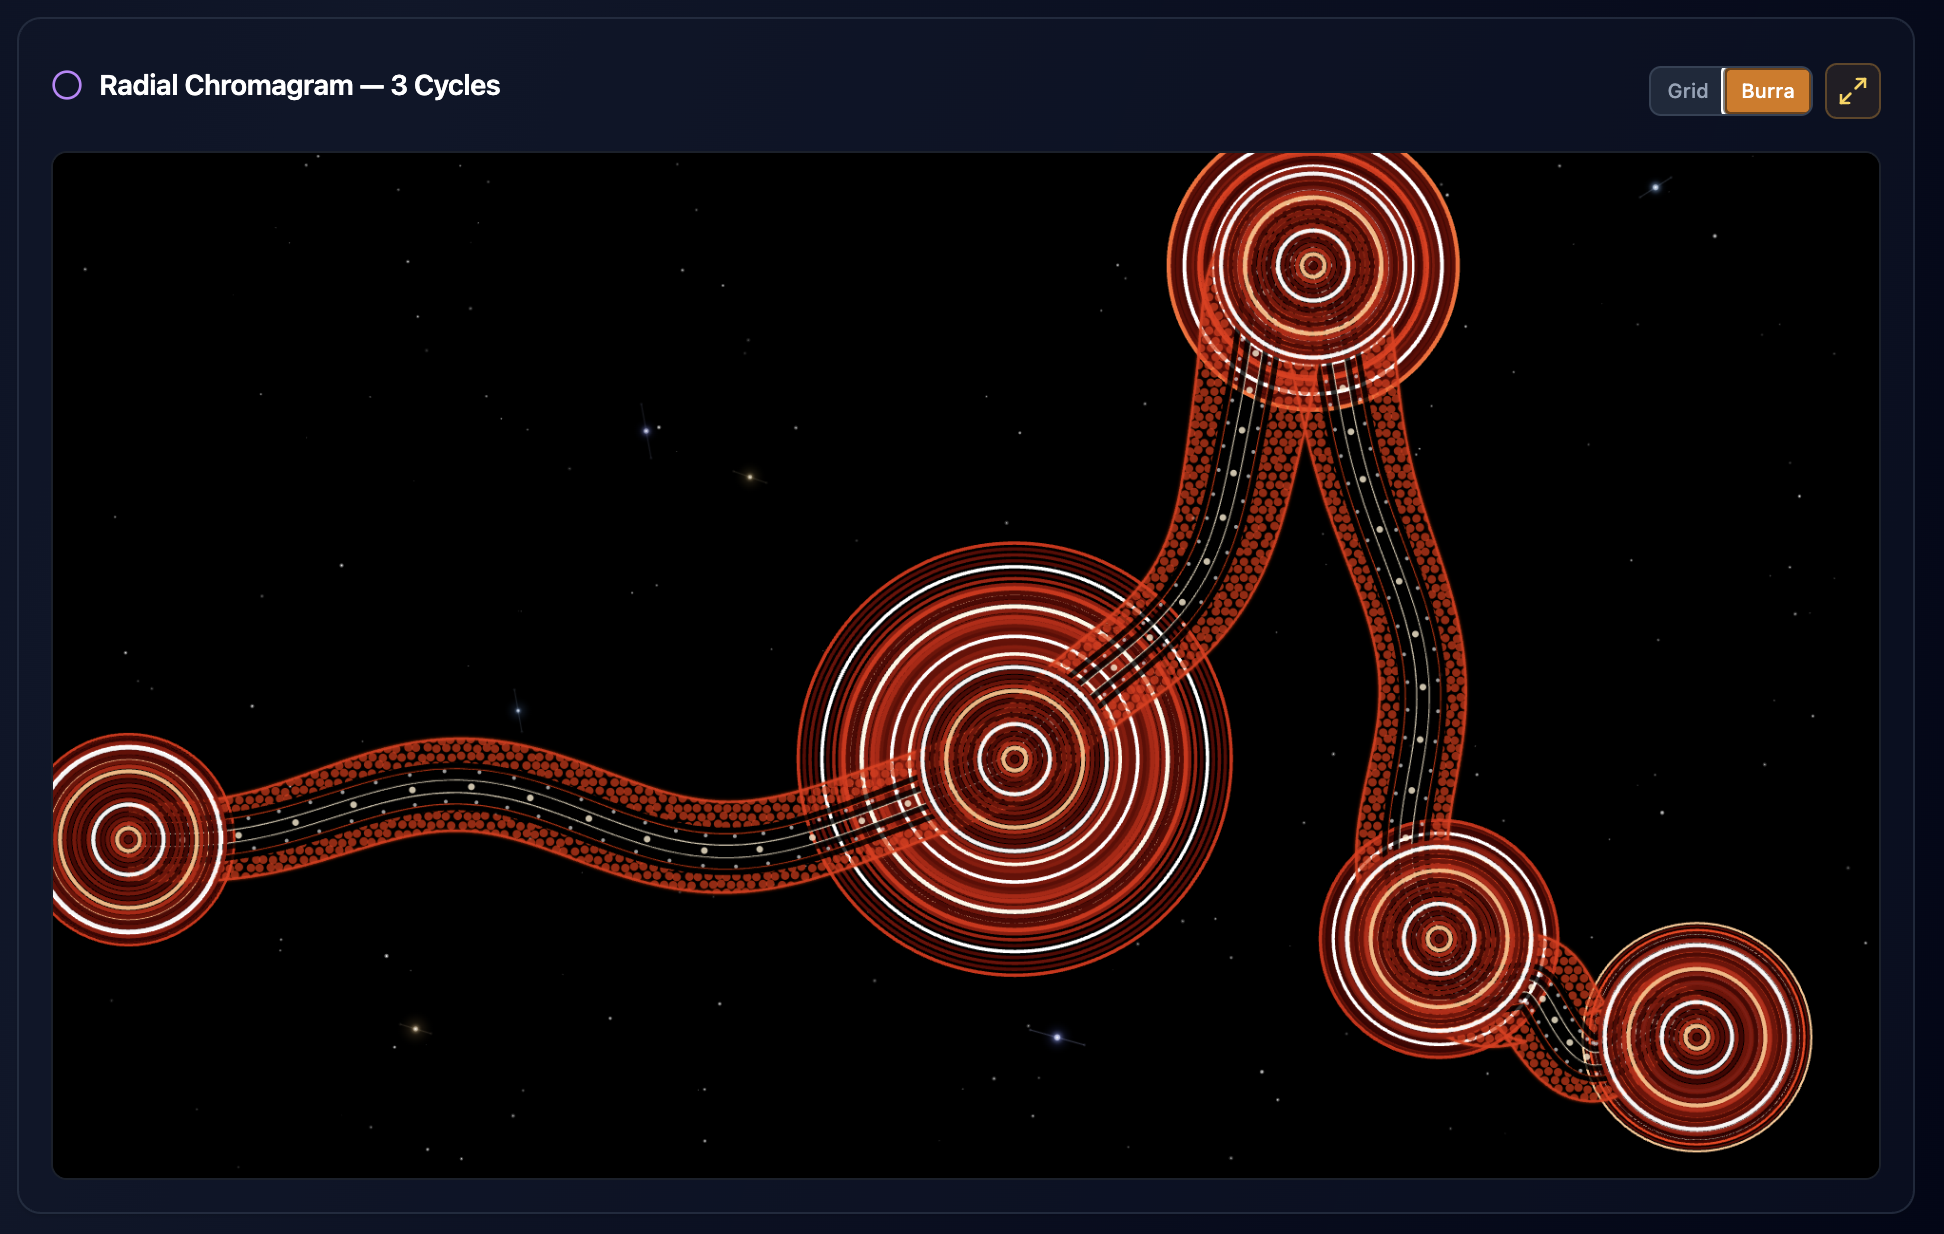
Radial chromagram — burra mode
Preview (PowerPoint template)
Cue Points & Panel Distribution
Dividing each composition into panel groups
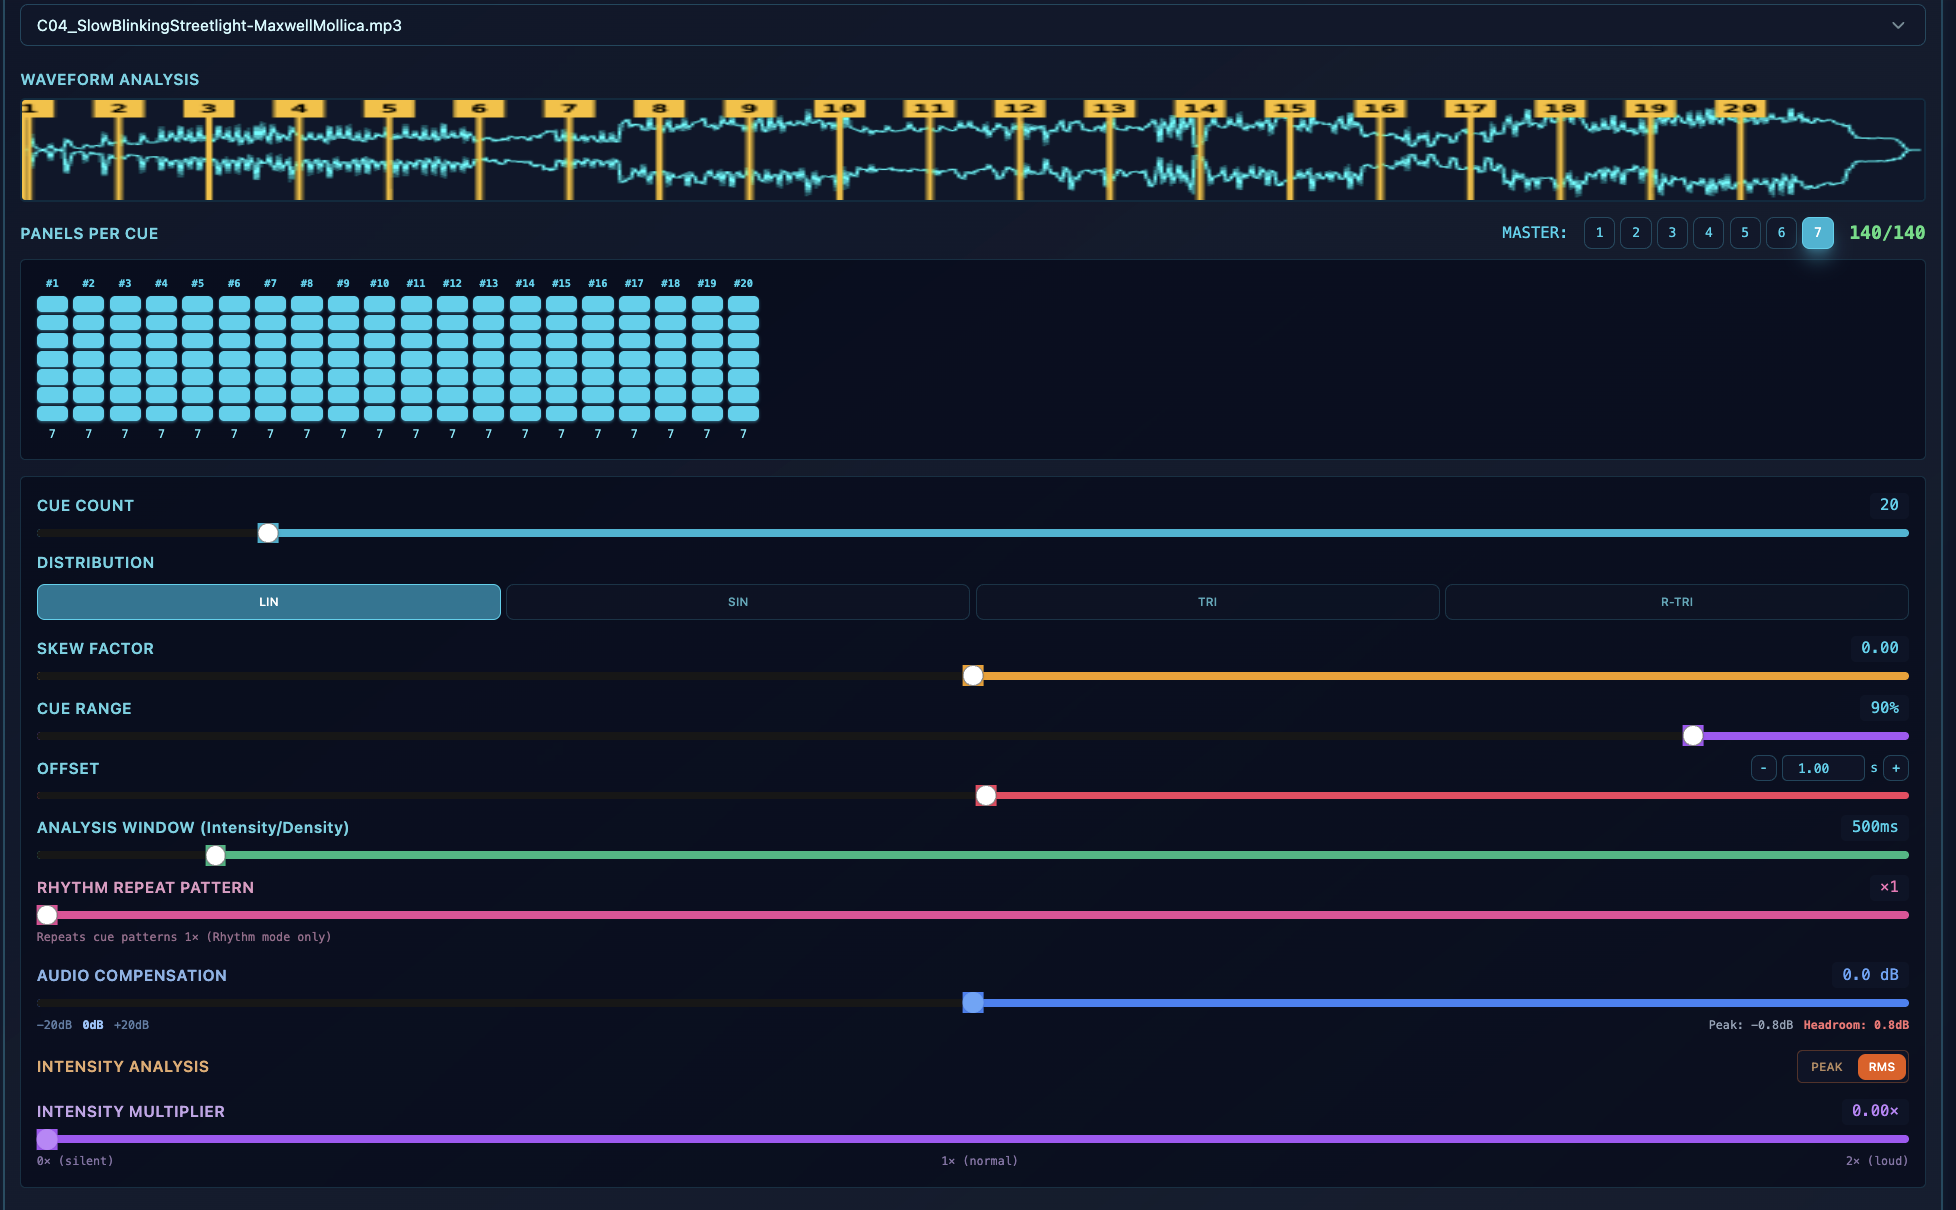
- Waveform analysis with numbered cue markers across the timeline
- Panels per cue: 140 panels distributed across 20 cues for Band 4
- Cue controls: count, distribution curve, skew, range, offset, window
- Audio compensation and intensity analysis tune the extraction
Preview (PowerPoint template)
Credits & Acknowledgements
The people behind the wall
- Skyscrapers · Alexander Benson
- Lagoon Vignettes · Jessica Foreman
- Long Night Chorale · Prof. Deborah Cheetham Fraillon AO
- Slow Blinking Streetlight · Maxwell Mollica
- DesignInc · Chromagram Station 60 design team
Preview (PowerPoint template)
The Original Application
chroma.spher8.com — where the wall was designed
- A purpose-built tool: upload audio, analyse it, and compose the wall live
- The Station 60 canvas renders all 530 panels at true scale in the browser
- Every design decision is adjustable in real time against the playing music
- Design provenance: every panel on the wall traces back to a decision made here
Preview (PowerPoint template)
The Design Interface
Controls that shaped the final wall
- Patch Cord Mapper — routes the 12 chromagram bins to the 7 shape colours
- Colour overrides — custom, preset and USYD palette schemes per shape
- Colour adjustors — min/max intensity, luminosity, saturation, invert order
- Chromagram bin ordering — chromatic, circle of fifths or intensity-based
- Per-band setup — audio source, cue points and panel counts for all four bands
- Scene presets — 10 save slots, plus JPEG, JSON, PDF export and re-analysis